In this section, we will explain some basic things about Google Chrome DevTools that might help you build web pages.
Opening DevTools
You will need to have Google Chrome installed on your machine.
Open Google Chrome and press f12. A window will be displayed in the right section of the browser.
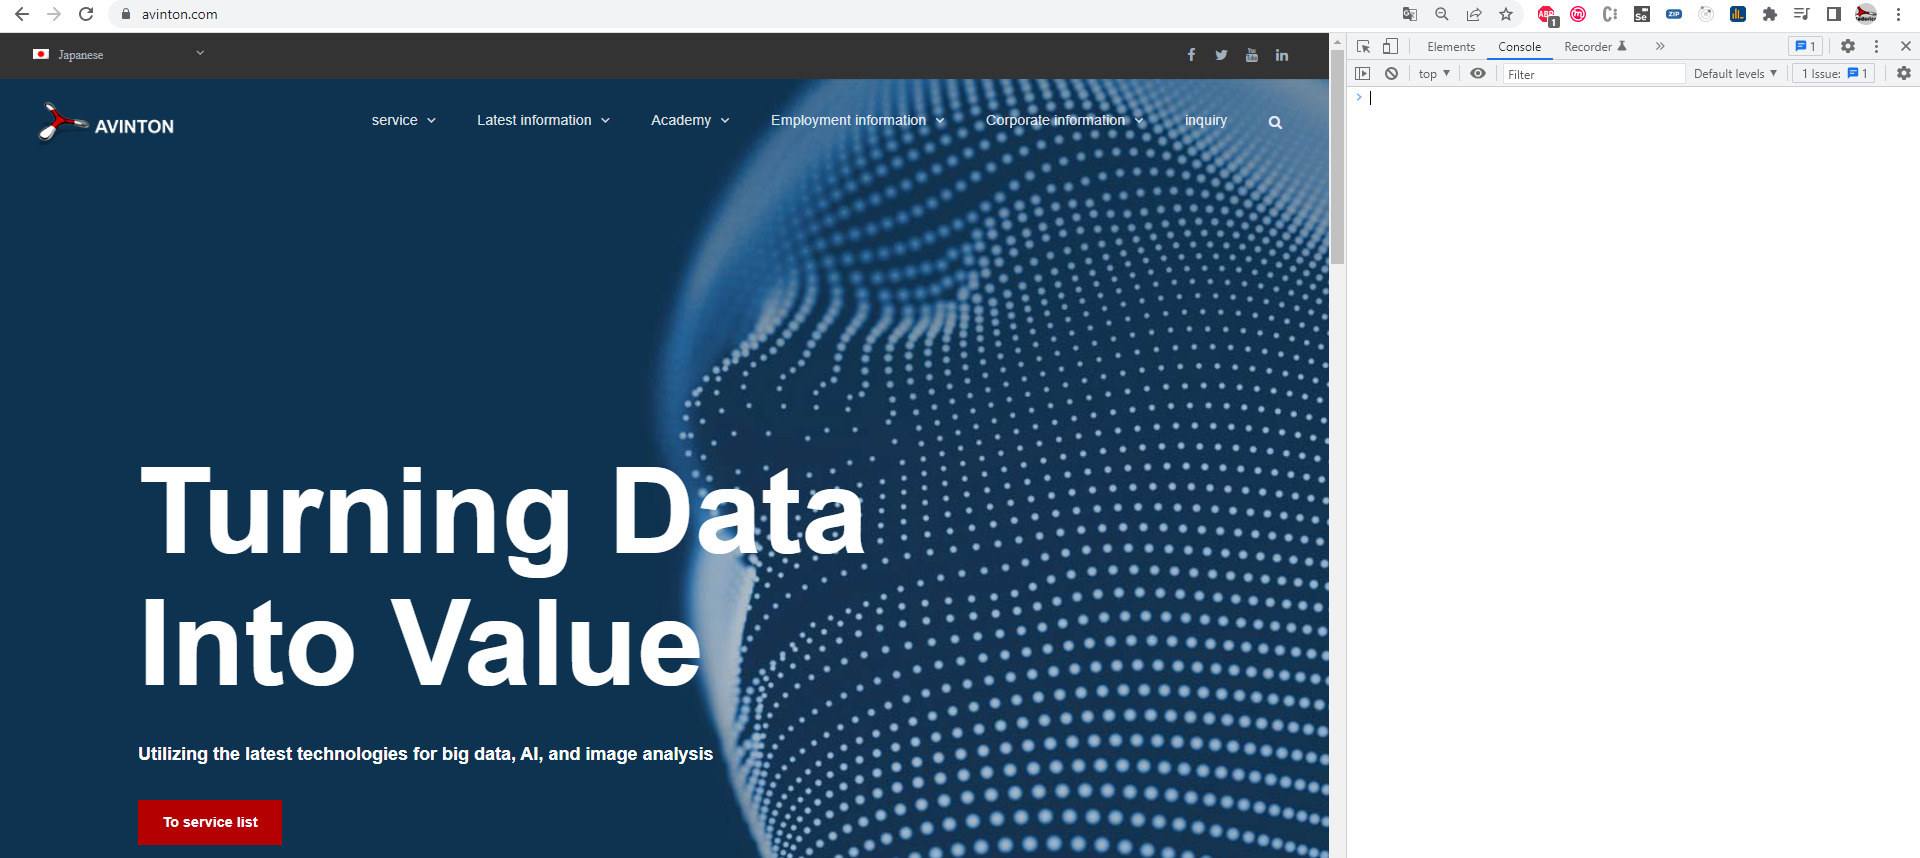
You will see the console, where you can write any JavaScript code you want, and then it will be executed on the website on the left.

Testing websites using different mobile devices
DevTools allows developers to test the website on different mobile devices.
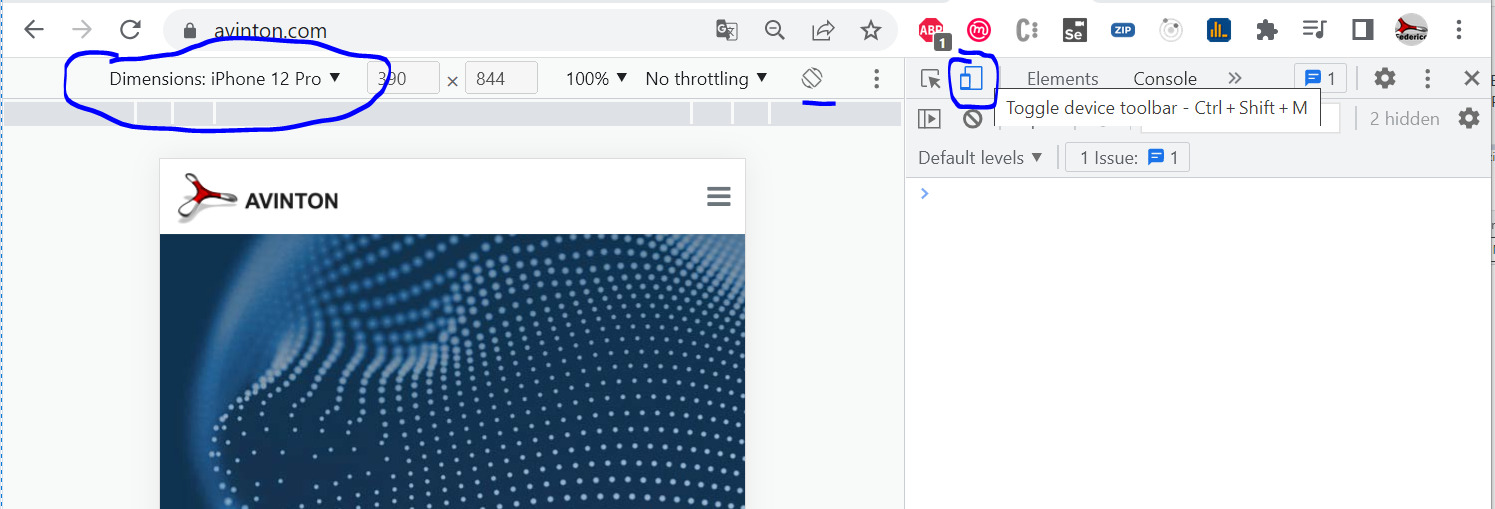
Click to activate the toggle device toolbar and lots of options will be displayed.
You can switch between the different brands of phones and also rotate the phone.
Note: Although this is a helpful feature, it’s not perfect. It’s always recommended to do a final test on a real mobile device as well.
Analyzing elements of the website
The network tab allows you to see all the images and HTML code that is downloaded when you access a website.
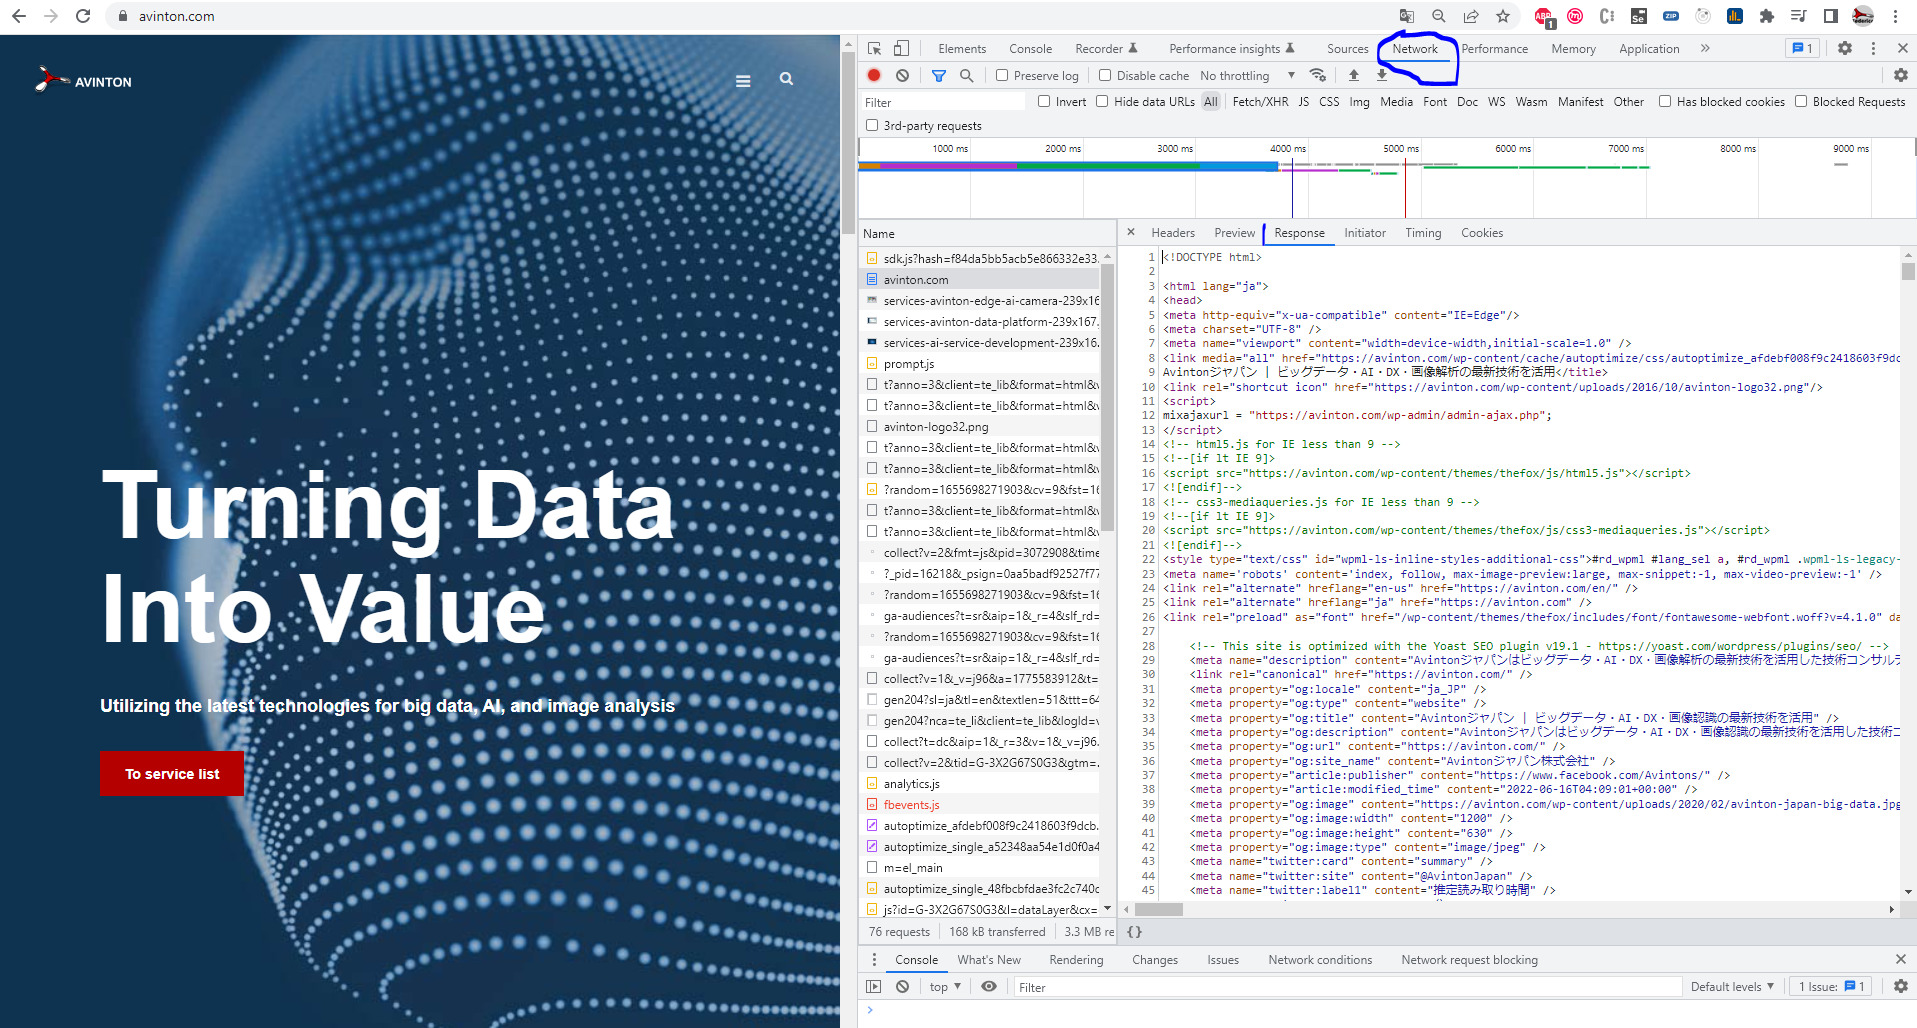
Here you can see:
- How many files the website consists of.
- How much time it takes to download those files.
- How big they are.
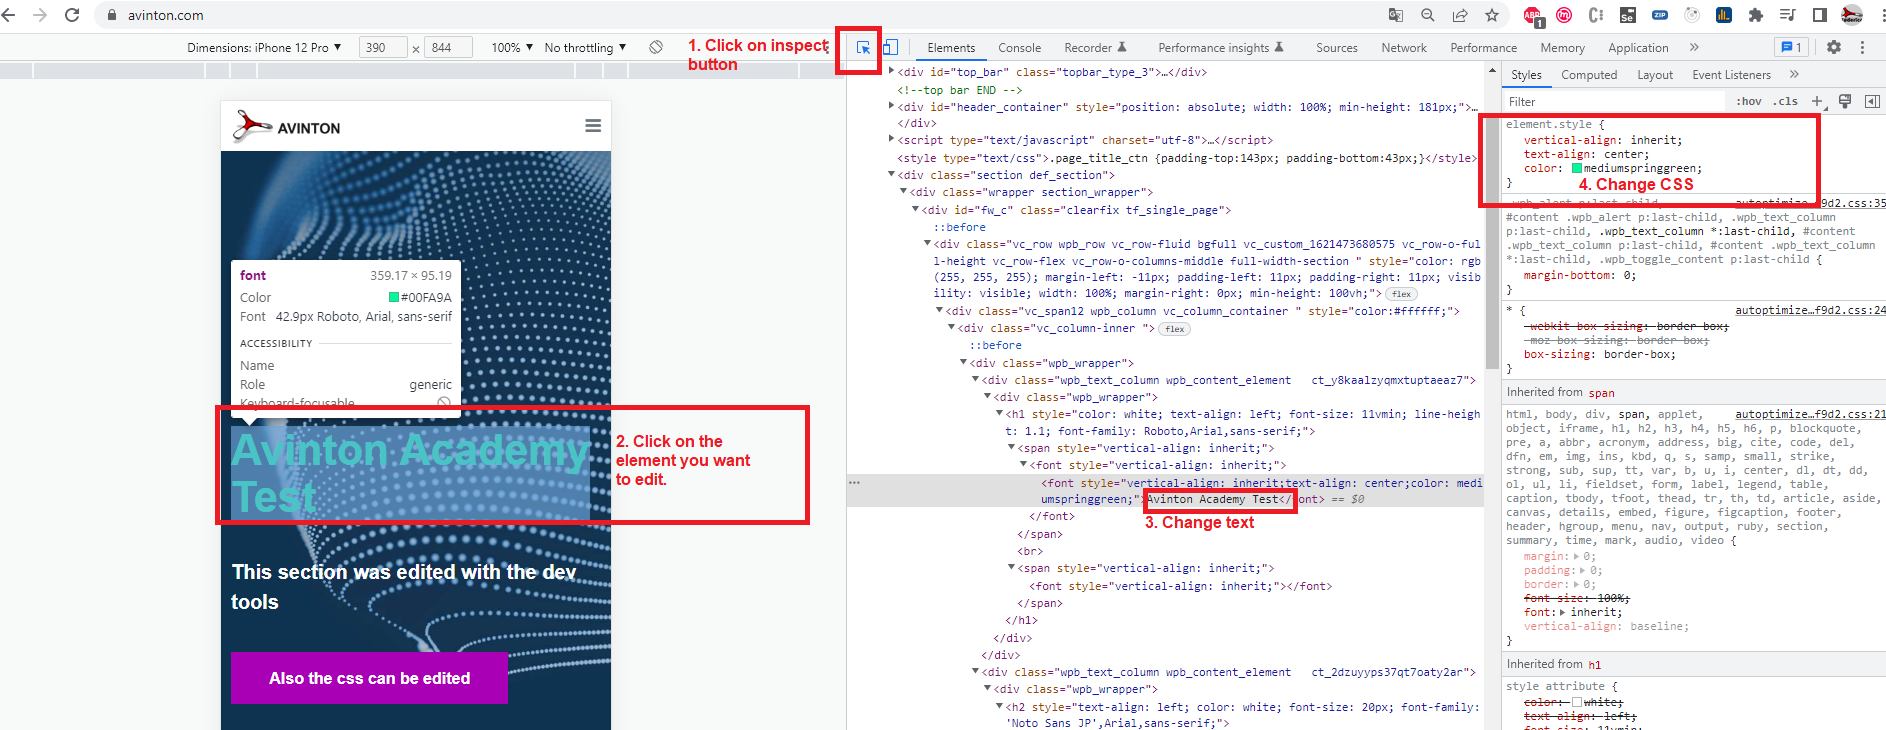
Editing elements content from the DevTools
DevTools allows you to edit the HTML and CSS of the website. This is really helpful sometimes since it allows you to test changes directly on production.
Understanding effects
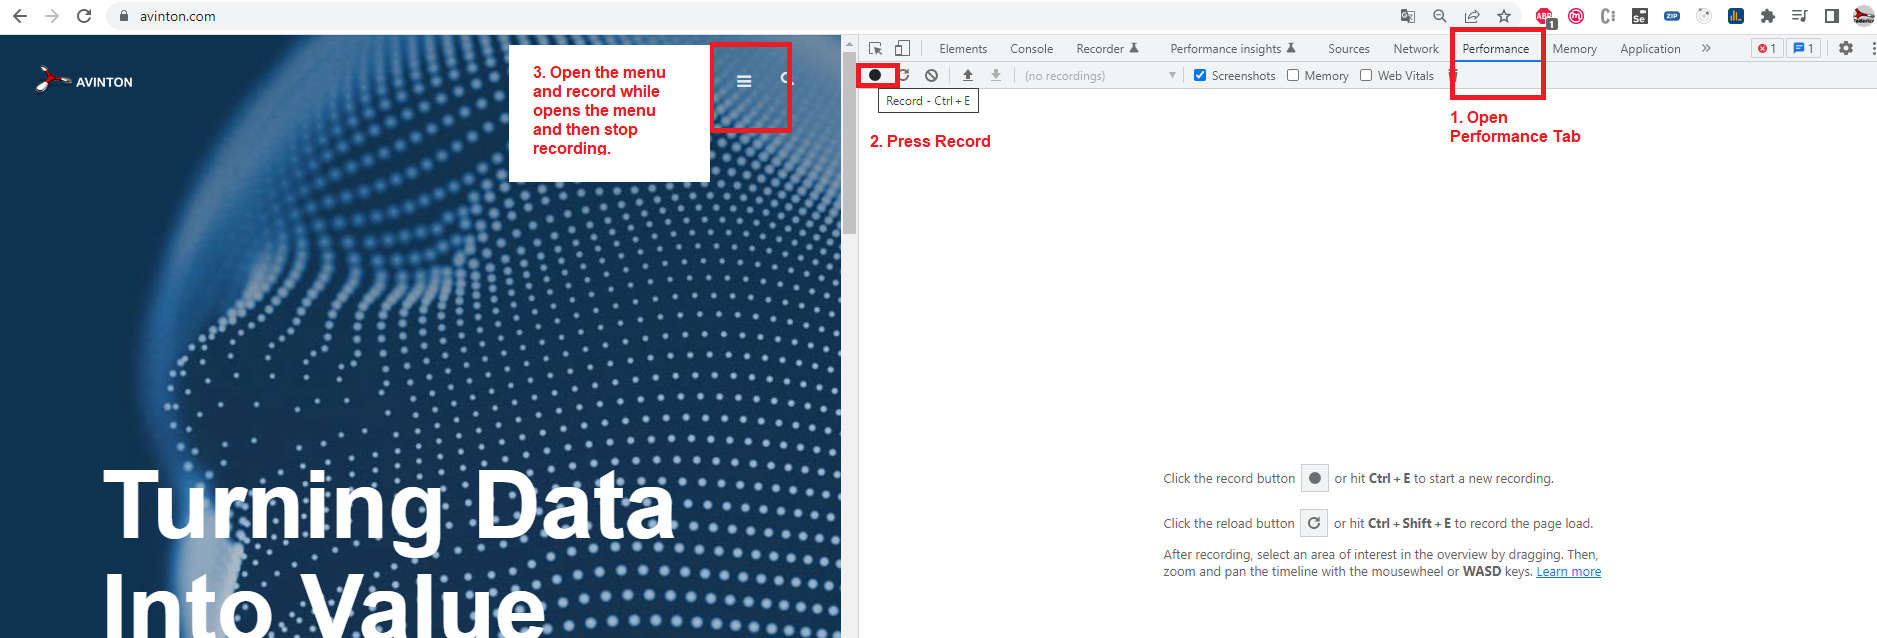
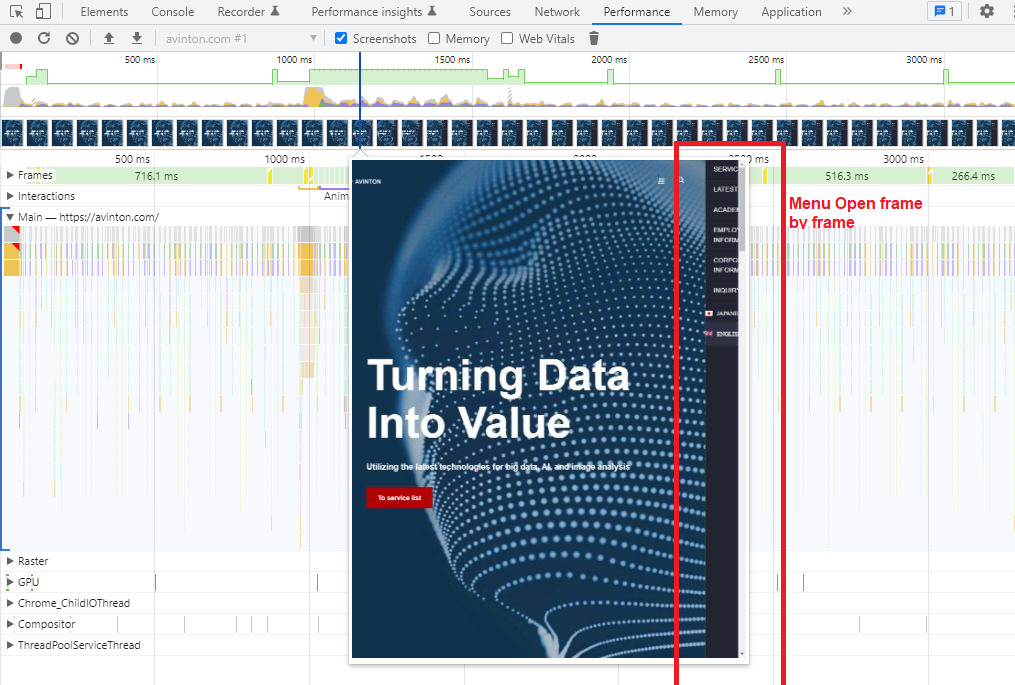
The most common issue when working with visualization effects (e. g. a menu opening) is that the code runs faster than the human eye can see.
Here is a sample of how can we see the visualization effect frame by frame, in order to detect possible errors.
